Motivation: combine yearly statistics for Belgium on a single page.
This page shows past daily forecast data of photo-voltaic (PV) solar and wind energy, as well as daily electricity loads in Belgium from Elia, the Belgian electricity transmission system operator. In general forecast data is more accurate than weather re-analysis of satellite data. Data is available from the year 2015 to 2022.
Over the past years final energy fluctuated in the range of 375 Terrawatt-hour (TWh) in Belgium. Electricity is about a fifth or 80 TWh of used final energy, as shown according to fuel type in the left figure below. Shown in the right part is the final energy consumption per sector in the economy. On this page we show produced wind and photovoltaic electricity as part of the total electricity load, without considering the other fuel types. The gap between wind/solar and total electricity consumption is mainly covered by nuclear and gas power. Post-processed energy balance data for Belgium is avalable at energy.at-site.be/eurostat-2022/EU/Belgium.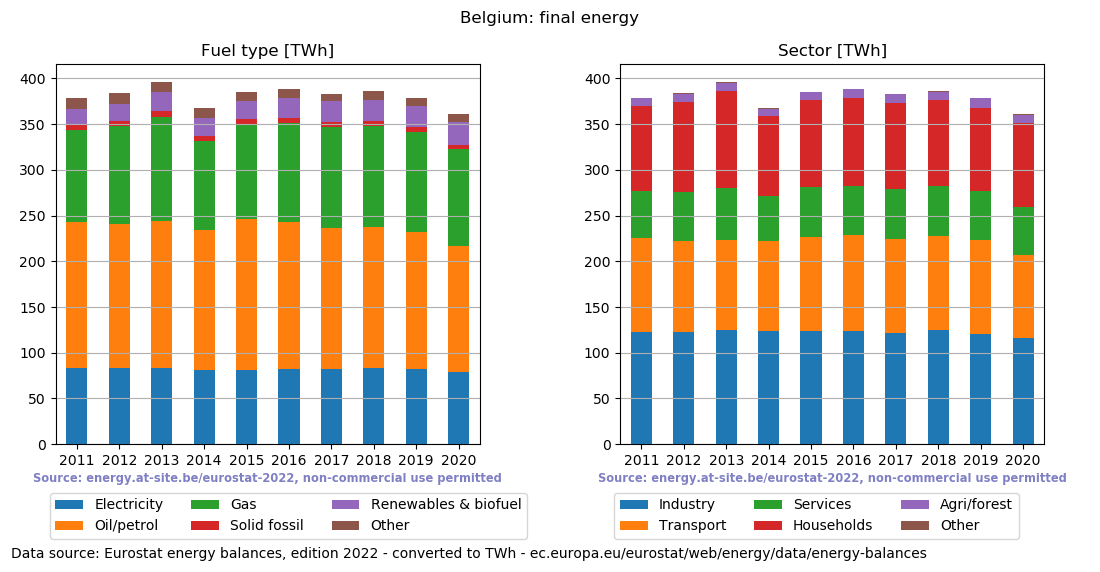
Acknowledgement: many thanks to Elia for open access to electicity load, solar and wind grid data of Belgium at www.elia.be/en/grid-data. This data is licensed under the Elia Open Data License, which uses the CC BY-4.0 public license, and is governed by Belgian law.
Also, we would like to express our gratitude to Eurostat, part of the European Commission, for allowing free re-use of energy balances and related data. Website: ec.europa.eu/eurostat/web/energy. Eurostat is not responsible for data conversion or rounding errors in post processing their original data set of energy balances.
User guide: hover over the plot to view monthly or daily energy production data, expressed in GigaWatt-hour (GWh). Capacity is expressed in MegaWatt-peak (MWp) and normalized energy values in kiloWatt-hour per day (kWh/d), normalized to kiloWatt-peak (kWpeak). Capacity values can be obtained by dividing kWh/d values by a factor 24 (hours). Electricity loads are expressed in GWh. You can disable or enable energy sources by clicking on the legend of a figure and zoom in on parts of the figure. A png image can be downloaded with the pop-up window at the right upper side. Also you can zoom in to view a subset of the data. These functions require that javascript is enabled.
History:
January 2022October 2021


![energy [a] at-site.be](https://energy.at-site.be/email.png)