This page shows the energy use for Serbia, using 0.11 percent of world energy production for 6.93 million inhabitants in 2019. Energy is typically specified in Million metric Ton of Oil Equivalent [Mtoe] for large quantities. This work prefers to use TeraWatt-hours (TWh) instead, which is obtained by multiplying the a value expressed in Mtoe with a factor 11.63 . To allow an easy comparison between countries, we normalize the TWh value to kiloWatt-hour per day per person (kWh/d/p) - David MacKay introduced this energy unit in [5]. Day to day energy production or consumption can fluctuate from a kWh/d/p value, for example space heating consumes more energy in the winter season.
These values are summarized in table 0.1 . The first two columns show the gross inland energy consumption and gross renewable and biofuel consumptions. We do so since some renewable and biofuel sources are converted to electricity for final energy consumption. The third column shows the total final energy consumption of Serbia. The fourth column shows the electricity consumption, which is a part of the final energy consumption.
The main data source for this page are the Eurostat energy balances, edition April 2022. A population plot of Serbia and a list of data source references are available below.Table 0.1 Energy summary for Serbia in 2016.
| Gross inland consumption | Gross renewable and biofuel consumption | Final energy consumption | Electricity consumption |
|---|---|---|---|
| 15.4 Mtoe | 2.0 Mtoe | 8.21 Mtoe | 2.37 Mtoe |
| 179 TWh | 23.3 TWh | 95.4 TWh | 27.6 TWh |
| 69.3 kWh/d/p | 8.99 kWh/d/p | 36.9 kWh/d/p | 10.7 kWh/d/p |
| 100 % (gross) | 13.0 % (gross) | 53.2 % (gross) | 15.4 % (gross) |
| 188 % (final) | 24.4 % (final) | 100 % (final) | 28.9 % (final) |
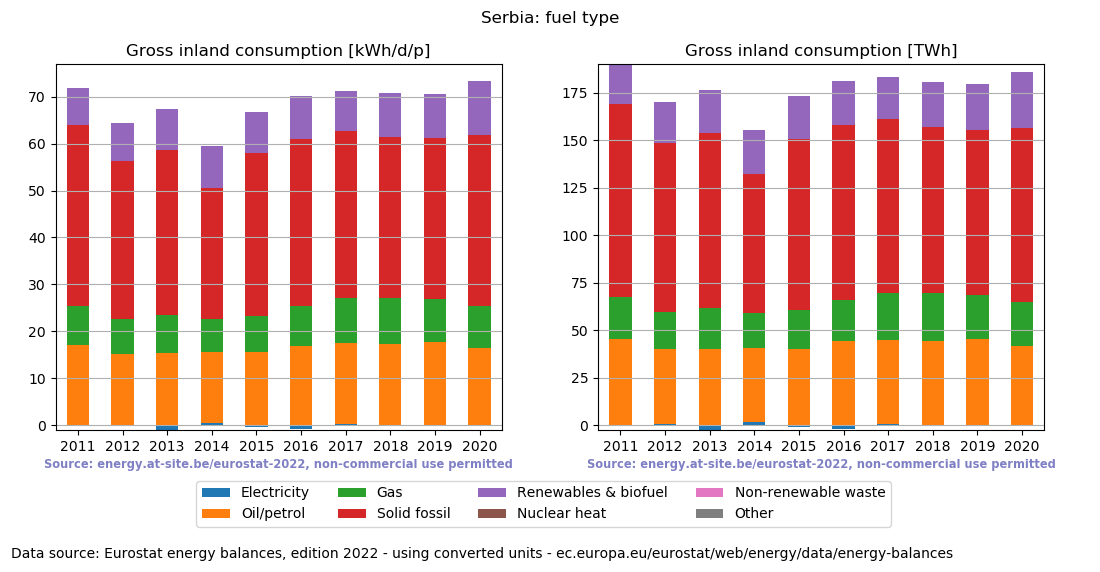
Figure 0.1 Serbia yearly gross inland energy consumption, split according to fuel type.
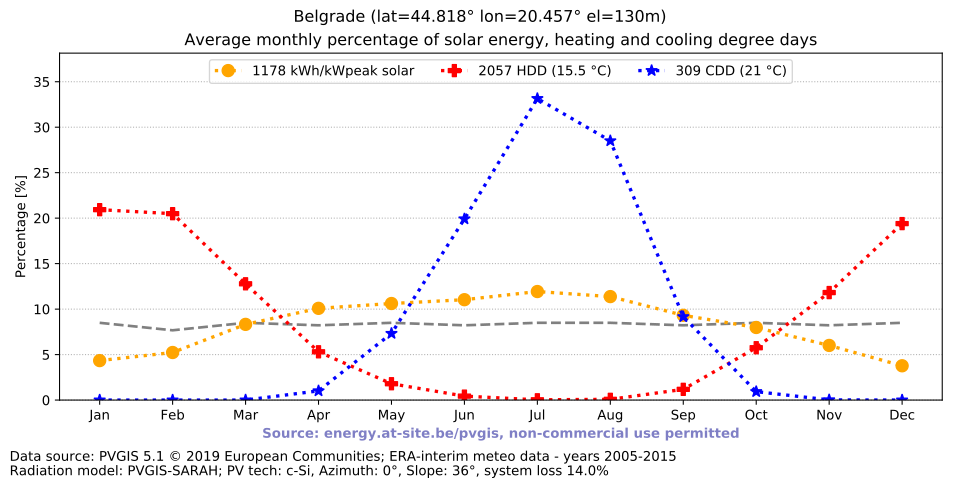
Figure 0.2 Monthly average percentage of solar photovoltaics, heating and cooling degree days for Belgrade in Serbia.
Energy balance summary, using kWh/d/p to express energy consumption
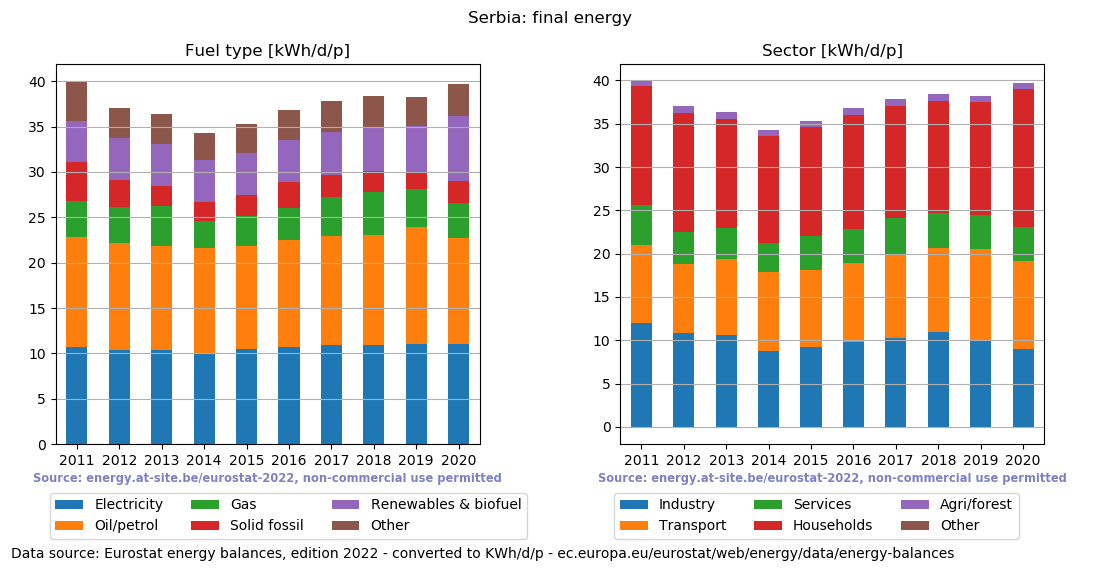
Figure 1.1 Yearly final energy consumption in kWh/d/p for Serbia.
Table 1.1 Final energy consumption in kWh/d/p for Serbia in 2016.
| Serbia 2016 [kWh/d/p] | Total | Electricity | Oil and petroleum products | Natural gas | Solid fossil fuels | Renewables and biofuels | Non-renewable waste | Heat |
|---|---|---|---|---|---|---|---|---|
| Gross inland consumption | 69.3 +4.49% | -0.74 +110% | 17.0 +9.56% | 8.49 +8.34% | 35.6 +2.56% | 8.99 +3.88% | 0.0048 +25.3% | 0.0 |
| Final energy consumption | 36.9 +4.34% | 10.7 +1.79% | 11.8 +3.6% | 3.55 +6.55% | 2.85 +27.3% | 4.68 +0.47% | 0.0024 +4.86% | 3.28 +2.14% |
| + Industry sector | 9.76 +6.51% | 3.09 +6.41% | 1.6 +0.45% | 1.97 +0.94% | 1.58 +26.4% | 0.59 -1.12% | 0.0024 +4.86% | 0.9 +5.49% |
| + Transport sector | 9.11 +2.45% | 0.14 +0.55% | 8.95 +2.5% | 0.023 -5.98% | 0.0 | 0.0 | 0.0 | 0.0 |
| + Other sectors | 18.0 +4.16% | 7.43 =0.0% | 1.24 +17.4% | 1.56 +14.8% | 1.27 +28.4% | 4.09 +0.71% | 0.0 | 2.38 +0.94% |
| ++ Services | 3.98 +1.61% | 1.93 +1.99% | 0.33 +1.41% | 0.7 +15.7% | 0.3 +4.21% | 0.15 -38.5% | 0.0 | 0.56 +0.88% |
| ++ Households | 13.1 +3.74% | 5.38 -0.67% | 0.29 +7.69% | 0.75 +11.3% | 0.97 +38.5% | 3.92 +3.33% | 0.0 | 1.82 +0.95% |
| ++ Agri/forest | 0.86 +26.4% | 0.12 -1.0% | 0.61 +34.7% | 0.1 +40.3% | 0.0 | 0.025 -19.2% | 0.0 | 0.0 |
Energy balance summary, using percent to express energy consumption.
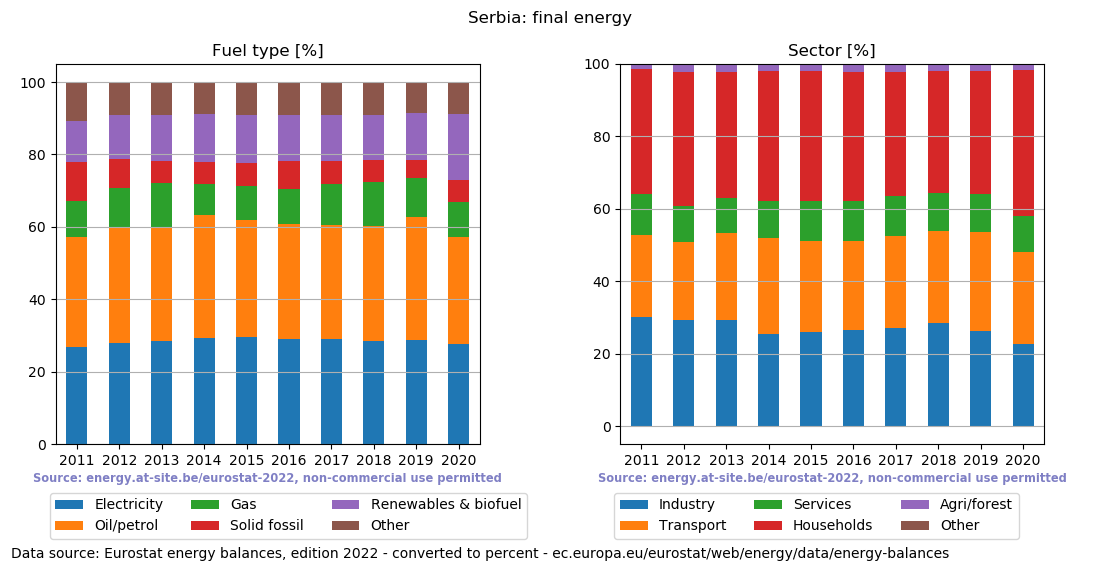
Figure 1.2 Yearly final energy consumption in percent for Serbia.
Table 1.2 Final energy consumption in percent for Serbia in 2016.
| Serbia 2016 [percent] | Total | Electricity | Oil and petroleum products | Natural gas | Solid fossil fuels | Renewables and biofuels | Non-renewable waste | Heat |
|---|---|---|---|---|---|---|---|---|
| Gross inland consumption | 188% +0.26% | -2.01% -1.01% | 46.1% +2.2% | 23.0% +0.85% | 96.5% -1.67% | 24.4% -0.11% | 0.013% =0.0% | 0.0% =0.0% |
| Final energy consumption | 100% =0.0% | 28.9% -0.73% | 32.0% -0.23% | 9.63% +0.2% | 7.74% +1.4% | 12.7% -0.49% | 0.0064% =0.0% | 8.89% -0.19% |
| + Industry sector | 26.5% +0.54% | 8.38% +0.16% | 4.33% -0.17% | 5.34% -0.18% | 4.29% +0.75% | 1.61% =0.0% | 0.0064% =0.0% | 2.43% =0.0% |
| + Transport sector | 24.7% -0.46% | 0.37% =0.0% | 24.3% -0.43% | 0.063% =0.0% | 0.0% =0.0% | 0.0% =0.0% | 0.0% =0.0% | 0.0% =0.0% |
| + Other sectors | 48.8% =0.0% | 20.2% -0.87% | 3.36% +0.37% | 4.23% +0.39% | 3.45% +0.65% | 11.1% -0.4% | 0.0% =0.0% | 6.46% -0.22% |
| ++ Services | 10.8% -0.29% | 5.24% -0.12% | 0.9% =0.0% | 1.91% +0.19% | 0.82% =0.0% | 0.4% -0.28% | 0.0% =0.0% | 1.53% =0.0% |
| ++ Households | 35.6% -0.2% | 14.6% -0.74% | 0.8% =0.0% | 2.04% +0.13% | 2.63% +0.65% | 10.6% -0.1% | 0.0% =0.0% | 4.93% -0.17% |
| ++ Agri/forest | 2.34% +0.41% | 0.33% =0.0% | 1.66% +0.38% | 0.28% =0.0% | 0.0% =0.0% | 0.069% =0.0% | 0.0% =0.0% | 0.0% =0.0% |
Energy balance summary, using TWh to express energy consumption
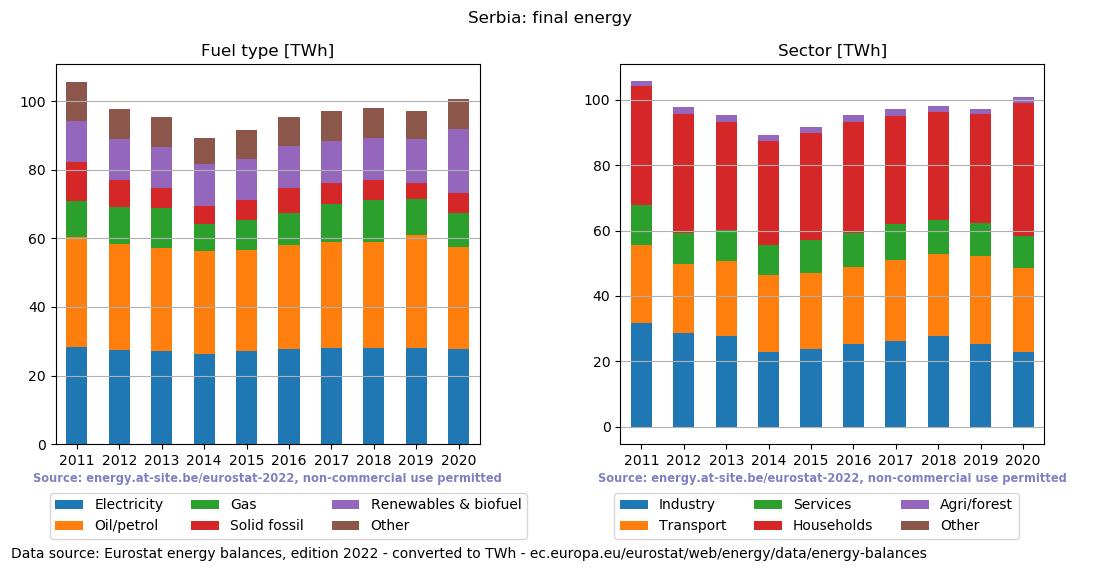
Figure 1.3 Yearly final energy consumption in TWh for Serbia.
Table 1.3 Final energy consumption in TWh for Serbia in 2016.
| Serbia 2016 [TWh] | Total | Electricity | Oil and petroleum products | Natural gas | Solid fossil fuels | Renewables and biofuels | Non-renewable waste | Heat |
|---|---|---|---|---|---|---|---|---|
| Gross inland consumption | 179 +4.21% | -1.92 +109% | 44.0 +9.28% | 22.0 +8.06% | 92.1 +2.3% | 23.3 +3.6% | 0.013 +25.0% | 0.0 |
| Final energy consumption | 95.4 +4.06% | 27.6 +1.52% | 30.5 +3.33% | 9.19 +6.27% | 7.39 +27.0% | 12.1 +0.21% | 0.0061 +4.58% | 8.49 +1.87% |
| + Industry sector | 25.3 +6.23% | 8.0 +6.13% | 4.13 +0.18% | 5.09 +0.68% | 4.1 +26.1% | 1.53 -1.38% | 0.0061 +4.58% | 2.32 +5.21% |
| + Transport sector | 23.6 +2.18% | 0.35 +0.28% | 23.2 +2.24% | 0.06 -6.23% | 0.0 | 0.0 | 0.0 | 0.0 |
| + Other sectors | 46.6 +3.88% | 19.2 -0.26% | 3.21 +17.1% | 4.04 +14.5% | 3.29 +28.1% | 10.6 +0.44% | 0.0 | 6.16 +0.67% |
| ++ Services | 10.3 +1.34% | 5.01 +1.73% | 0.86 +1.14% | 1.82 +15.4% | 0.78 +3.94% | 0.38 -38.7% | 0.0 | 1.46 +0.61% |
| ++ Households | 34.0 +3.47% | 13.9 -0.93% | 0.76 +7.41% | 1.95 +11.0% | 2.51 +38.1% | 10.2 +3.06% | 0.0 | 4.7 +0.69% |
| ++ Agri/forest | 2.24 +26.1% | 0.31 -1.26% | 1.59 +34.3% | 0.27 +39.9% | 0.0 | 0.066 -19.4% | 0.0 | 0.0 |
Renewables and biofuel gross inland energy consumption
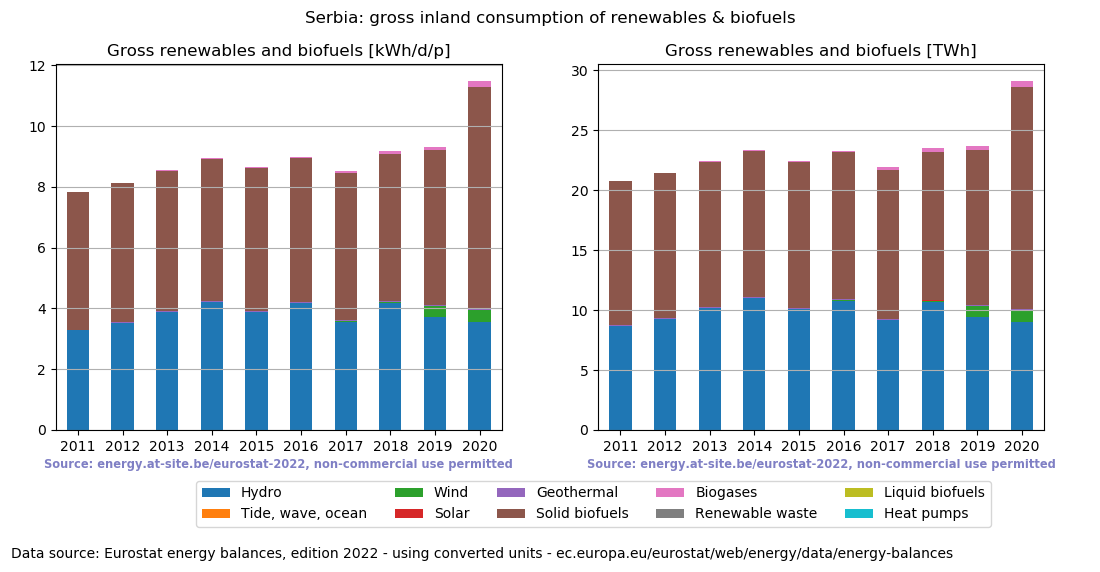
Figure 1.4 Yearly gross inland consumption of renewables and biofuels for Serbia.
Table 1.4 Gross inland consumtion of renewables and biofuels for Serbia in 2016.
| Serbia 2016 renewables and biofuels | [percent (gross)] | [percent (final)] | [kWh/d/p] | [percent] | [TWh] |
|---|---|---|---|---|---|
| Gross inland consumption | 100% (gross) | 188% (final) | 69.3 | 771% | 179 |
| Renewables and biofuels - gross inland consumption | 13.0% (gross) | 24.4% (final) | 8.99 | 100% | 23.3 |
| Hydro (39.1% of electricity) | 6.01% (gross) | 11.3% (final) | 4.17 | 46.4% | 10.8 |
| Tide, wave, ocean (0.0% of electricity) | 0.0% (gross) | 0.0% (final) | 0.0 | 0.0% | 0.0 |
| Wind (0.094% of electricity) | 0.014% (gross) | 0.027% (final) | 0.01 | 0.11% | 0.026 |
| Solar photovoltaic (0.043% of electricity) | 0.0067% (gross) | 0.013% (final) | 0.0046 | 0.052% | 0.012 |
| Solar thermal | 0.0% (gross) | 0.0% (final) | 0.0 | 0.0% | 0.0 |
| Geothermal | 0.033% (gross) | 0.063% (final) | 0.023 | 0.26% | 0.06 |
| Primary solid biofuels | 6.91% (gross) | 13.0% (final) | 4.79 | 53.3% | 12.4 |
| Charcoal | -0.06% (gross) | -0.11% (final) | -0.042 | -0.47% | -0.11 |
| Biogases | 0.048% (gross) | 0.089% (final) | 0.033 | 0.37% | 0.085 |
| Renewable municipal waste | 0.0% (gross) | 0.0% (final) | 0.0 | 0.0% | 0.0 |
| Pure biogasoline | 0.0% (gross) | 0.0% (final) | 0.0 | 0.0% | 0.0 |
| Blended biogasoline | 0.0% (gross) | 0.0% (final) | 0.0 | 0.0% | 0.0 |
| Pure biodiesels | 0.0% (gross) | 0.0% (final) | 0.0 | 0.0% | 0.0 |
| Blended biodiesels | 0.0% (gross) | 0.0% (final) | 0.0 | 0.0% | 0.0 |
| Pure bio jet kerosene | 0.0% (gross) | 0.0% (final) | 0.0 | 0.0% | 0.0 |
| Blended bio jet kerosene | 0.0% (gross) | 0.0% (final) | 0.0 | 0.0% | 0.0 |
| Other liquid biofuels | 0.0% (gross) | 0.0% (final) | 0.0 | 0.0% | 0.0 |
| Ambient heat (heat pumps) | 0.0% (gross) | 0.0% (final) | 0.0 | 0.0% | 0.0 |
Population trend
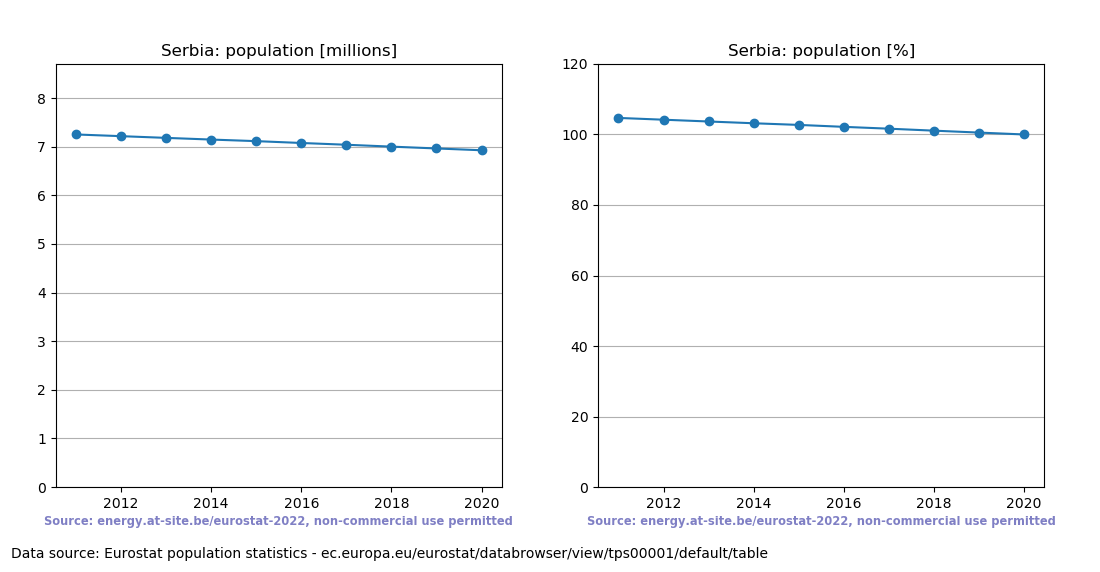
Figure 2.1 Population trend for Serbia.
Acknowledgement: We would like to express our gratitude to Eurostat, part of the European Commission, for allowing free re-use of energy balances and related data. Website: ec.europa.eu/eurostat/web/energy.
Disclaimer: This work provides a summary of the original data, converting ktoe (kilo ton oil equivalent) values to other energy units such as relative percentages, TWh (TeraWatt-hours) and normalized kWh/d/p (kiloWatt-hours per day per person) values. Values are rounded to 3 significant digits. Eurostat is not responsible for data conversion or rounding errors in doing so.
Other visualizations: Since 2022 Eurostat provides a set of interactive visualization tools for energy at ec.europa.eu/eurostat/web/energy/visualisations. For energy balances Total energy supply is used there, which is equivalent to the Gross inland consumption minus the energy of international aviation.
References:



![energy [a] at-site.be](https://energy.at-site.be/email.png)